Practice – Analyze position-time graph
A car is moving to the right and the position-time graph of the car is given below. Study the plot and answer the following questions.
(a) Identify the sections where the car is at rest.
(b) Identify the sections where the car is moving at a constant velocity.
(c) Identify the sections where the car is moving at a non-uniform motion.
(d) Identify the point where the car changes direction.
(e) What are the differences between sections A and E?
(f) Is the car speeding up or slowing down in section C? Think about a reason.
A car started moving to the right and the position-time graph of the car is given below. Find the velocity of the car in each section. Which section has the highest velocity and in which direction?

A car started moving to the right and the position-time graph of the car is given below. Find the velocity of the car in each section. Which section has the highest velocity and in which direction?

The motion of a car is given below. Describe the motion in each time segment. Assume moving to the right side as the positive X.
A person who walks for exercise produces the position-time graph given with this problem. (a) Without doing any calculations, decide which segments of the graph (A, B, C, or D) indicate positive, negative, and zero average velocities. (b) Calculate the average velocity for each segment to verify your answers to part (a).
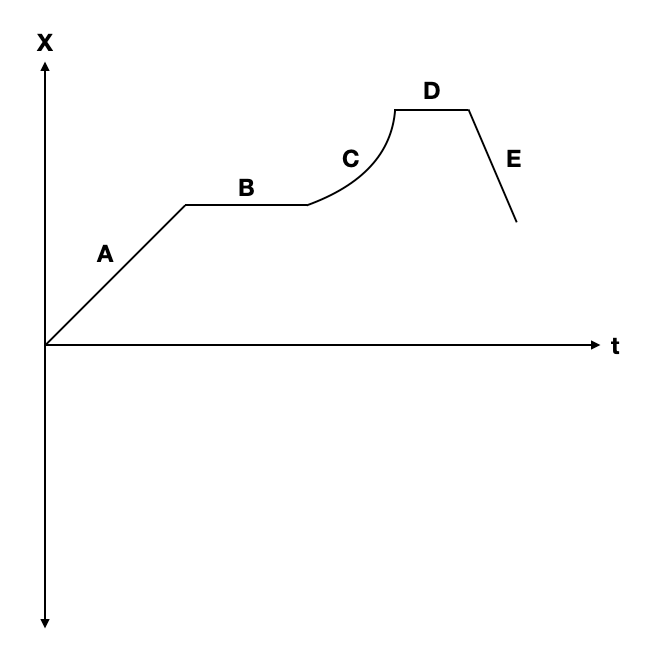
Study the position-time graph of a car below and answer the questions:
(a) Identify the sections where the car is at rest.
Section B and D
(b) Identify the sections where the car is moving at a constant velocity.
Section A and E
(c) Identify the sections where the car is moving at a non-uniform motion.
Section C
(d) Identify the point where the car changes direction.
Where section D and E crosses
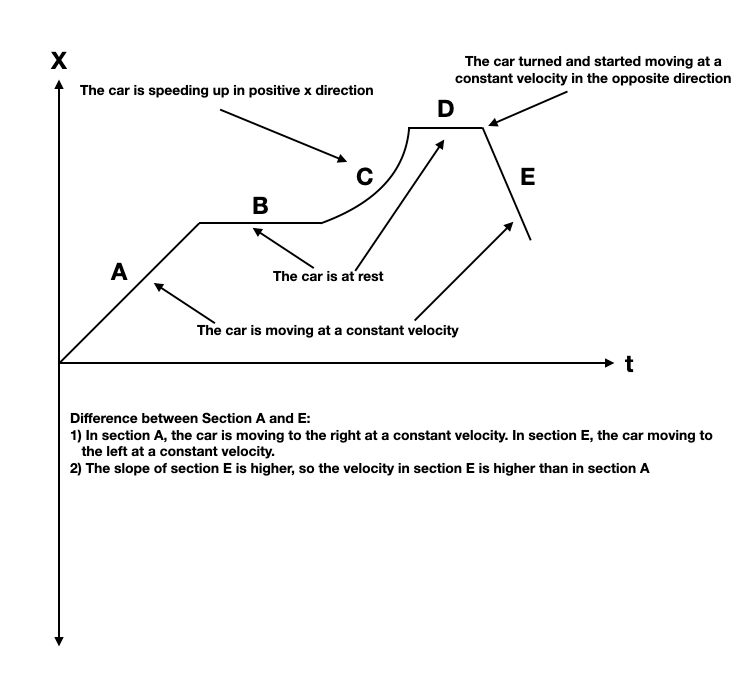
(e) What are the differences between sections A and E?
1) In section A, the car is moving to the right at a constant velocity. In section E, the car moving to the left at a constant velocity.
2) The slope of section E is higher, so the velocity in section E is higher than in section A.
(f) Is the car speeding up or slowing down in section C? Think about a reason.
The car is speeding up in this section as the slope is increasing from the starting point of section C towards the end of the section.
A car started moving to the right and the position-time graph of the car is given below. Find the velocity of the car in each section. Which section has the highest velocity and in which direction?
Velocity in section A = Slope of the line = (8 – 0)/(4 – 0) m/s = 2 m/s
Velocity in section B = Slope of the line = 0 m/s ( The car is at rest)
Velocity in section C = Slope of the line = (2 – 8)/(12 – 10) = -6/2 = -3 m/s ( The car is moving to the left at velocity 3m/s).
The velocity is highest in section C.
A car started moving to the right and the position-time graph of the car is given below. Find the velocity of the car in each section. Which section has the highest velocity and in which direction?
Velocity in section A = Slope of the line = (-8-7)/(5-0) =-15/5=-3 m/s
Velocity in section B = Slope of the line = 0 m/s
Velocity in section C = Slope of the line =(0-(-8))/(11-9) = 8/2 = 4 m/s
Velocity in section D = Slope of the line = 0 m/s
Velocity in section E = Slope of the line =(5-0)/(17-15)=5/2 =2.5 m/s
Velocity in section F = Slope of the line = (0-5)/(20-17) =-5/3 m/s=-1.66m/s
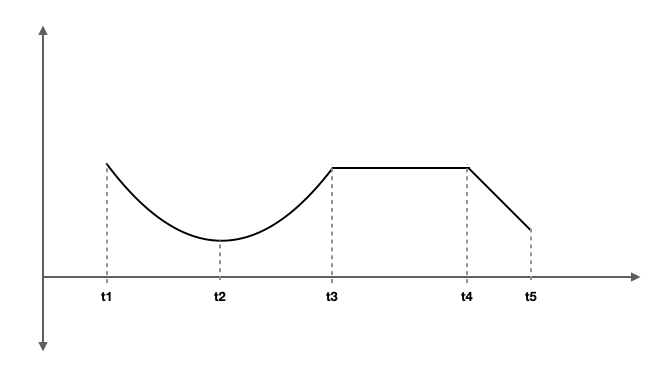
The motion of a car is given below. Describe the motion in each time segment. Assume moving to the right side as the positive X.
- This is a combination of uniform and non-uniform motion.
- Between t1-t2, the car moves to the left with decreasing velocity as the slope becomes smaller and smaller.
- At t2 the car turns and between t2 and t3, it speeds up in the right direction.
- At t3 the car stops and remains at rest till t4.
- At t4 it starts moving to the left at a constant velocity till t5.
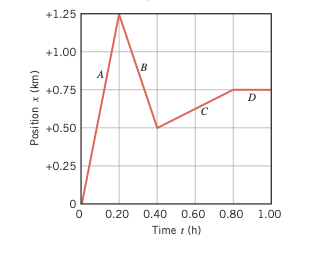
A person who walks for exercise produces the position-time graph given with this problem. (a) Without doing any calculations, decide which segments of the graph (A, B, C, or D) indicate positive, negative, and zero average velocities. (b) Calculate the average velocity for each segment to verify your answers to part (a).
(a)
Segment A and C are positive average velocity.
Segment B is the negative average velocity
Segment D is zero average velocity
(b)
Average velocity in segment A = (1.25-0)/(0.2-0) km/h = 6.25 km/h
Average velocity in segment B =(0.5-1.25)/(0.4-0.2) km/h = – 3.75 km/h
Average velocity in segment C = ((0.75-0.5)/(0.8-0.4) km/h = 0.625 km/h
Average velocity in segment D = (0.75-0.75)/(1.00-0.8) = 0 km/h