Practice – Solve problems involving VT and XT graphs
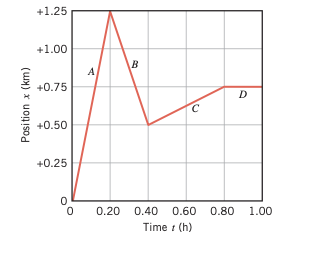
A person who walks for exercise produces the position-time graph given with this problem. (a) Without doing any calculations, decide which segments of the graph (A, B, C, or D) indicate positive, negative, and zero average velocities. (b) Calculate the average velocity for each segment to verify your answers to part (a). (c) Draw the corresponding velocity-time graph.
Study the v-t graph of a car.
(a)Find the average acceleration of the car in each segment.
(b) Describe the motion as a story.

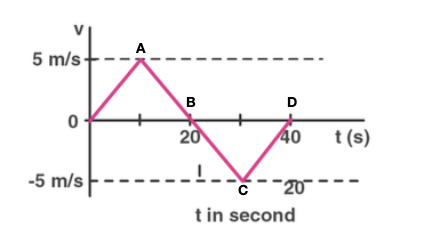
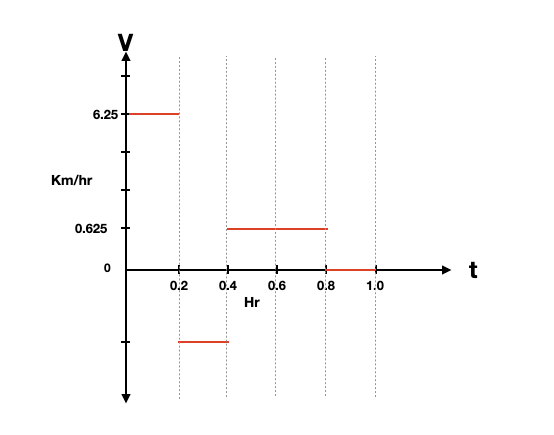
From the velocity-time plot shown in the figure, find the distance travelled by the particle during the first 40 seconds. Also, find the average velocity during this period.
Study the v-t graph given below. Find
(a) Average acceleration in each segment.
(b) Displacement between 0-5 sec.
(c) Draw an acceleration-time graph of this motion.
A person who walks for exercise produces the position-time graph given with this problem. (a) Without doing any calculations, decide which segments of the graph (A, B, C, or D) indicate positive, negative, and zero average velocities. (b) Calculate the average velocity for each segment to verify your answers to part (a). (c) Draw the corresponding velocity-time graph.
(a)
Positive velocity = Section A and C ( as they have positive slope);
Negative velocity = Section B ( As this section has a negative slope)
Zero velocity = Section D ( Zero slope)
(b)
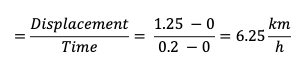
Average velocity in Section A = Slope of the line
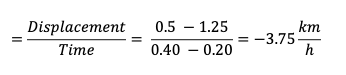
Average velocity in Section B = Slope of the line
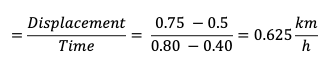
Average velocity in Section C = Slope of the line
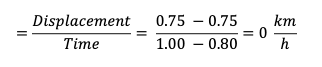
Average velocity in Section D = Slope of the line
(c)
Study the v-t graph of a car.
(a)Find the average acceleration of the car in each segment.
(b) Describe the motion as a story.
(a) Average acceleration in section OA = Slope of the line = (4 – 1) / (2 – 0) m/s² = 1.5 m/s²
Average acceleration in section AB = Slope of the line = (4 – 4) / (4 – 2) m/s² = 0 m/s²
Average acceleration in section BC = Slope of the line = (2 – 4) / (7 – 4) m/s² = – 0.66 m/s²
Average acceleration in section CD = Slope of the line = (0 – 2) / (9 – 2) m/s² = (-2/7 ) m/s²
(b) in section OA, the car is increasing its velocity uniformly, hence constant acceleration.
In section AB the car is moving at a constant velocity and hence the acceleration is 0.
In section BC, the car is slowing down but still moving in a positive direction ( since the value of velocity is still positive). It’s slowing down and hence its acceleration is negative.
In section CD, the car is slowing down to a stop but still moving in a positive direction ( since the value of velocity is still positive). It’s slowing down and hence its acceleration is negative.
From the velocity-time plot shown in the figure, find the distance traveled by the particle during the first 40 seconds. Also, find the average velocity during this period.
Area of the V-T graph gives distance travelled
Distance in first 40 sec = Area of triangle OAB+ Area of triangle BCD
= 1/2 x 5 x 20 + 1/2 x 5 x 20
= 100 m
The displacement is zero as the average velocity is zero.
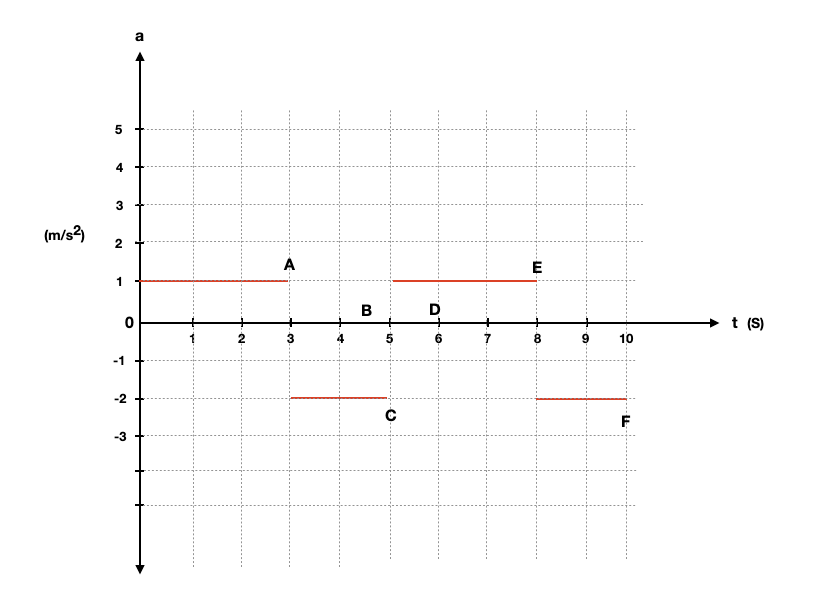
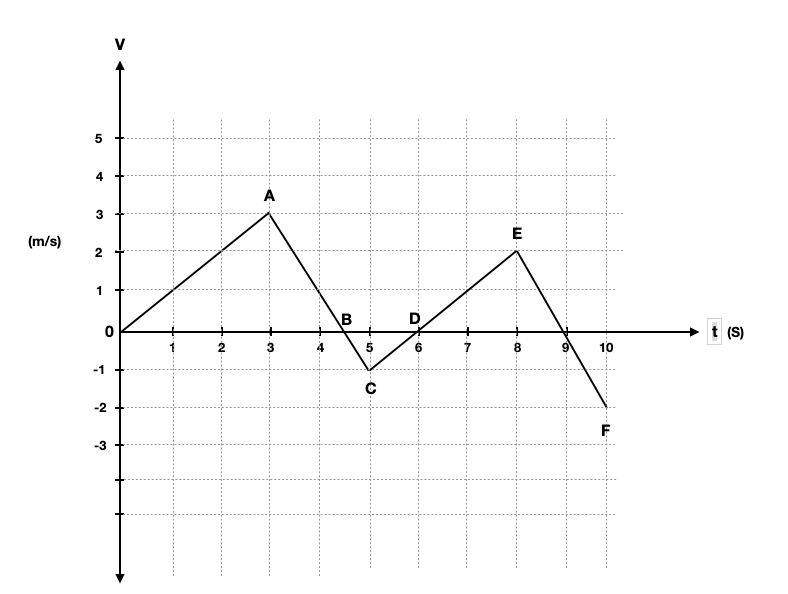
Study the v-t graph given below. Find
(a) Average acceleration in each segment.
(b) Displacement between 0-5 sec.
(c) Draw an acceleration-time graph of this motion.
(a) Average acceleration in section OA = Slope of the line = (3 -0) / (3 – 0) m/s² = 1 m/s²
Average acceleration in section AC = Slope of the line = (-1 – 3) / (5 – 3) m/s² = -2 m/s²
Average acceleration in section CE = Slope of the line = (2 – (-1)) / (8 – 5) m/s² = 1 m/s²
Average acceleration in section EF = Slope of the line = (-2 – 2) / (10 – 8) m/s² = -2 m/s²
(b)
Displacement between 0-5 sec
= Area under the graph between 0 -5 s
= Area of the triangle OAB + Area of triangle BCD
= (1/2) x 4.5 x 3 + (1/2) x 1.5 x 1
= 6.75 + 0.75 = 7.5 m
(c)